Profiling
Profiling
Profiling end-to-end a command line
- You can use the time-tested Linux
timecommand to profile both time and memory
```bash
/usr/bin/time -v COMMAND 2>&1 | tee time.log
Command being timed: "...COMMAND..." User time (seconds): 187.70 System time (seconds): 16.27 Percent of CPU this job got: 96% Elapsed (wall clock) time (h:mm:ss or m:ss): 3:31.38 Average shared text size (kbytes): 0 Average unshared data size (kbytes): 0 Average stack size (kbytes): 0 Average total size (kbytes): 0 Maximum resident set size (kbytes): 13083892 Average resident set size (kbytes): 0 Major (requiring I/O) page faults: 0 Minor (reclaiming a frame) page faults: 9911066 Voluntary context switches: 235772 Involuntary context switches: 724 Swaps: 0 File system inputs: 424 File system outputs: 274320 Socket messages sent: 0 Socket messages received: 0 Signals delivered: 0 Page size (bytes): 4096 Exit status: 0 ```
-
Information about the spent time are:
User time (seconds): 187.70 System time (seconds): 16.27 Percent of CPU this job got: 96% Elapsed (wall clock) time (h:mm:ss or m:ss): 3:31.38 -
The relevant part is the following line representing the amount of resident memory (which is ~13GB)
Maximum resident set size (kbytes): 13083892
Profiling Python code from command line
cProfile
Install in a Docker container
- From
devops/docker_build/install_cprofile.sh```bashsudo apt-get install -y python3-dev sudo apt install -y libgraphviz-dev sudo apt-get install -y graphviz pip install gprof2dot ```
How to use with workflow
- There is a script that runs the flow
amp/dev_scripts/run_profiling.sh
How to use manually
- You need to run the code first with profiling enabled to collect the profiling
data in a binary file (often called
prof.bin). ```bash # Profile a Python script.python -m cProfile -o prof.bin ${CMD} ```
- To profile a unit test you can run:
```bash # Profile a unit test.
python -m cProfile -o profile edgar/forms8/test/test_edgar_utils.py python -m cProfile -o profile -m pytest edgar/forms8/test/test_edgar_utils.py::TestExtractTablesFromForms::test_table_extraction_example_2 ```
- Plotting the results
```bash
gprof2dot -f pstats profile | dot -Tpng -o output.png gprof2dot -n 10 -f pstats profile | dot -Tpng -o output.png gprof2dot -n 10 -f pstats profile -l "extract_tables_from_forms" | dot -Tpng -o output.png ```
How to read a graph: https://nesi.github.io/perf-training/python-scatter/profiling-cprofile
- Gprof2dot has lots of interesting options to tweak the output, e.g.,
```bash
gprof2dot -h ... -n PERCENTAGE, --node-thres=PERCENTAGE eliminate nodes below this threshold [default: 0.5] -e PERCENTAGE, --edge-thres=PERCENTAGE eliminate edges below this threshold [default: 0.1] --node-label=MEASURE measurements to on show the node (can be specified multiple times): self-time, self-time-percentage, total-time or total-time-percentage [default: total- time-percentage, self-time-percentage] -z ROOT, --root=ROOT prune call graph to show only descendants of specified root function -l LEAF, --leaf=LEAF prune call graph to show only ancestors of specified leaf function --depth=DEPTH prune call graph to show only descendants or ancestors until specified depth --skew=THEME_SKEW skew the colorization curve. Values < 1.0 give more variety to lower percentages. Values > 1.0 give less variety to lower percentages -p FILTER_PATHS, --path=FILTER_PATHS Filter all modules not in a specified path ... ```
process_prof.py
- You can use the script
dev_scripts/process_prof.pyto automate some tasks: - Top-level statistics
- Plotting the call-graph
- Custom statics
line_profiler
-
CProfile allows to break down the execution time into function calls, while kernprof allows to profile a function line by line.
-
Install with: ```bash
pip install line_profiler ```
How to use
- Instrument the code to profile:
```python import line_profiler profiler = line_profiler.LineProfiler()
# Print the results at the end of the run. import atexit
def exit_handler(): profiler.print_stats()
atexit.register(exit_handler)
@profiler def function():
... ```
- Through command line:
```bash
kernprof -o prof.lprof -l $cmd ... Wrote profile results to run_process_forecasts.py.lprof ```
pytest-profiling
-
Install it with ```bash
pip install pytest-profiling ```
How to use
> pytest --profile ./amp/core/dataflow_model/test/test_pnl_simulator.py::TestPnlSimulator2::test_perf1 -s
Profiling in a Jupyter notebook
- You can find all of the examples below in action in the
amp/core/notebooks/time_memory_profiling_example.ipynblink.
Time profilers
- In a notebook, execute cell with
%timecell-magic:python %%time func()
By function
-
We prefer cProfile for profiling and gprof2dot for visualization.
-
The documentation does not state this, but
%prunmagic uses cProfile under the hood, so we can use it in the notebook instead
python
  # We can suppress output to the notebook by specifying "-q".
  %%prun -D tmp.pstats func() !gprof2dot -f pstats tmp.pstats | dot -Tpng -o output.png
  dspl.Image(filename="output.png")
-
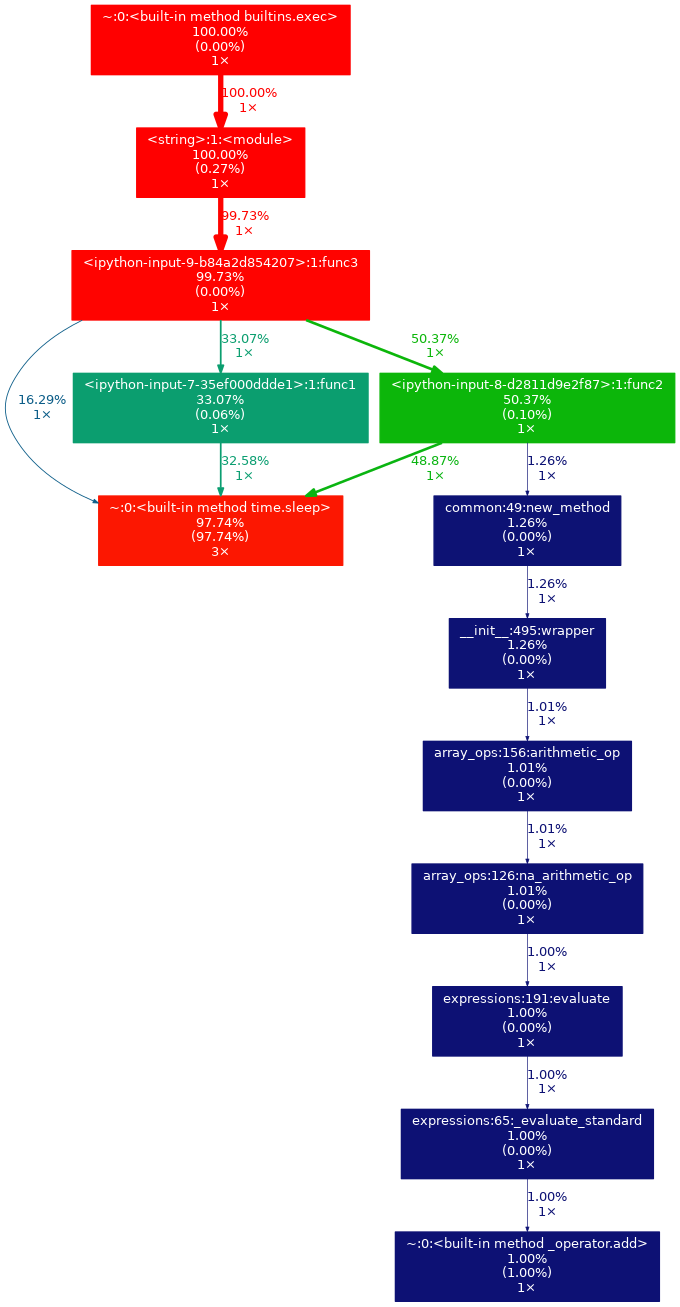
This will output something like this:

-
If you open the output image in the new tab, you can zoom in and look at the graph in detail.
-
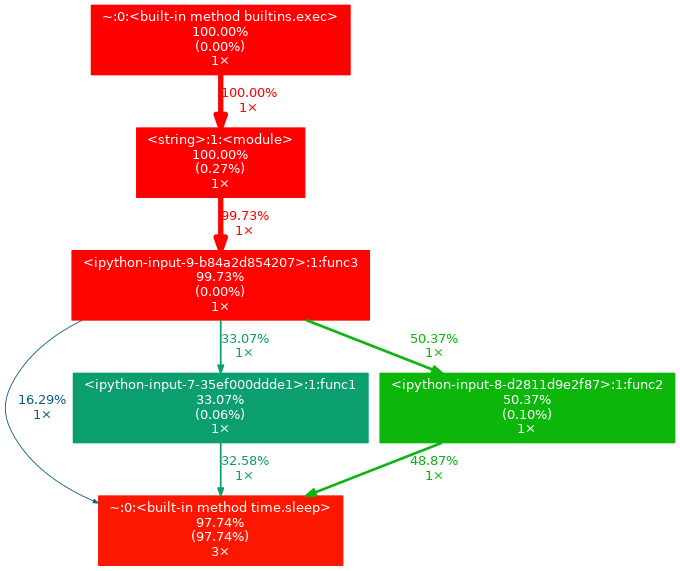
Gprof2dot supports thresholds that make output more readable:
python
  !gprof2dot -n 5 -e 5 -f pstats tmp.pstats | dot -Tpng -o output.png
  dspl.Image(filename="output.png")
- This will filter the output into something like this:

Memory profilers
-
We prefer using memory-profiler.
-
Peak memory
bash
  %%memit
  func()
- Memory by line
bash
  %mprun -f func func()